Performance History
History command
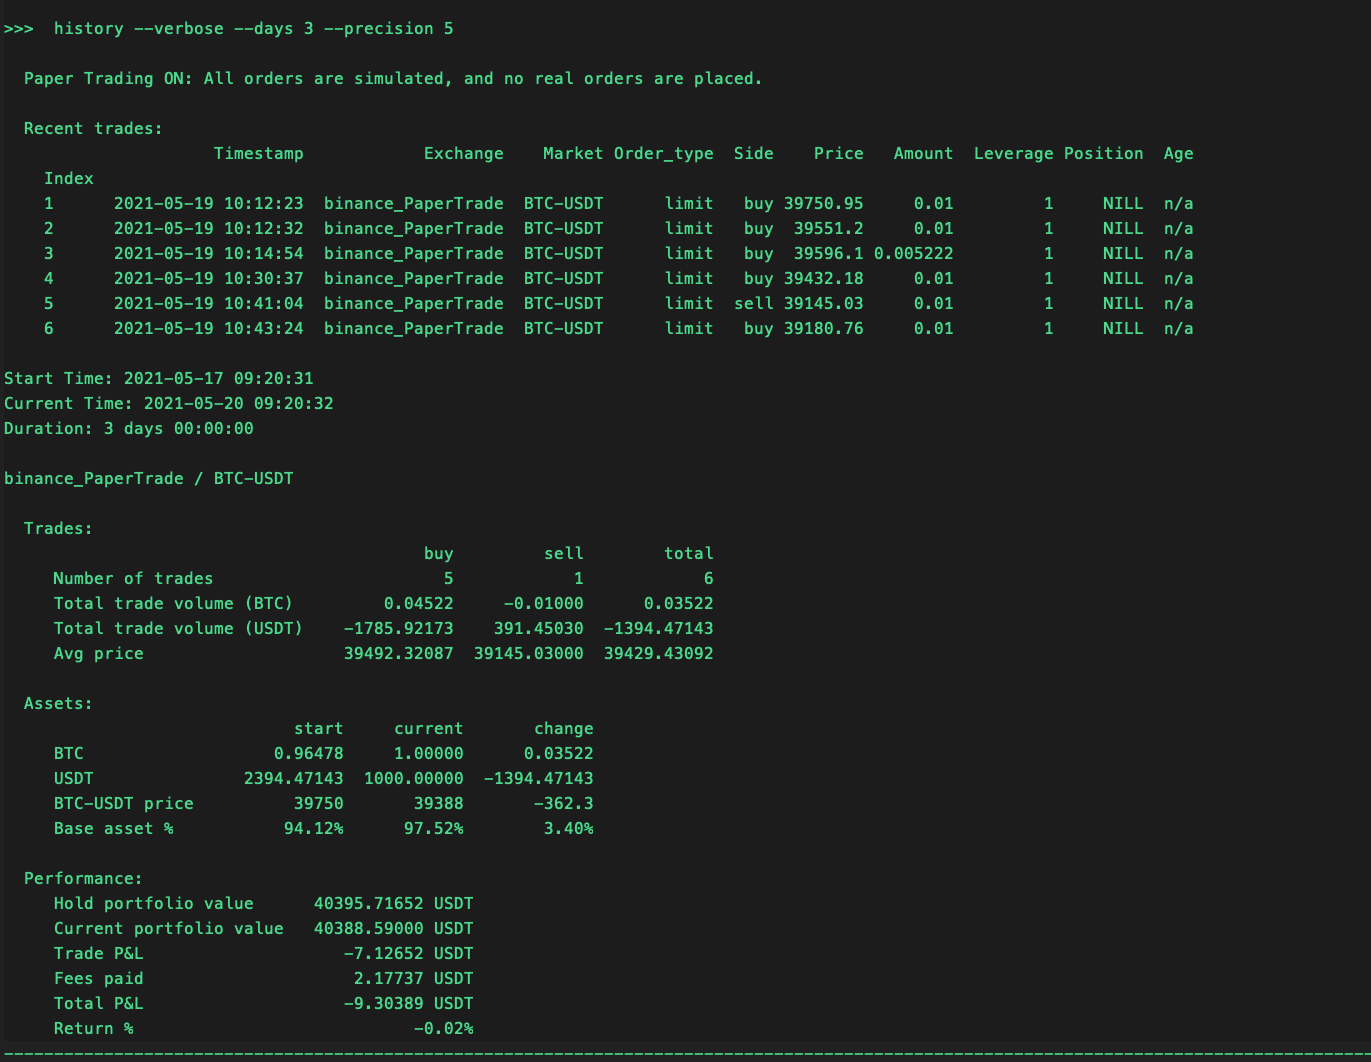
The history command displays the current duration of total past trades, asset inventory and value, and market trading pair performance. Run history --verbose to see all recent trades.
Trades are saved locally in a .csv file located in the data folder which you can view by running history --verbose --days command even after you restart Hummingbot.
Optional argument --precision specifies the number of decimal values.
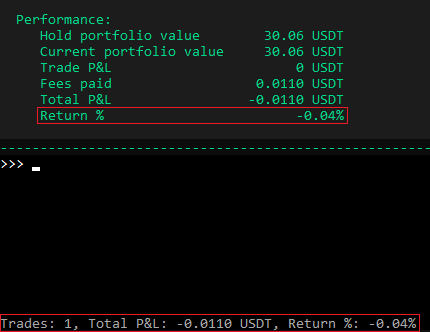
This block below shows the calculation for some of the values displayed in the history output.
Avg price = total trade volume of quote / total trade volume of base asset
Hold portfolio value = (base start asset * current market price) + quote start asset
Current portfolio value = (base current asset * current market price) + quote current asset
Trade P&L = current portfolio value - hold portfolio value
Total P&L = trade P&L + fees paid
Return % = total P&L / hold portfolio value
Tip
The Return % in the navbar at the bottom of Hummingbot client may be different from the history command output. This is because the Return % in history takes the price changes into calculation while the navbar in the bottom UI does not.
How It Works
Run the history command in Hummingbot to display the current duration of total past trades, asset inventory and value, market trading pair performance.
Sample Output
>>>  history

  Start Time: 2020-11-11 00:56:37
  Current Time: 2020-11-11 12:57:22
  Duration: 0 days 12:00:45

  binance / MFT-BNB

    Trades:
                                         buy        sell       total
      Number of trades                   113          97         209
      Total trade volume (BTC)       2181335    -2133912       47423
      Total trade volume (USDT)      -217,67      210.76       -6.91
      Avg price                    0.0000998   0.0000988   0.0001457

    Assets:

                                      Start      Current      Change
      MFT                            155248       202671       47423
      BNB                            23.331       16.419      -6.912
      MFT/BNB price               0.0001076    0.0000809  -0.0000267
      Base asset %                    41.7%        50.0%        8.2%

    Performance:
      Hold portfolio value           35.890 BNB
      Current portfolio value        32.815 BNB
      Trade P&L                      -3.075 BNB
      Fees paid                      -0.428 BNB
      Total P&L                      -3.504 BNB
      Return %:                      -9.76%
The following displays the formula for key calculations:
Note
For more details on the calculations, please see this Google Sheet.
Average Price
Avg Price = Total trade volume of quote/Total trade volume of base asset.
In the sample output, the total avg price is 6.91/47423 = 0.0001457
This value means the average price of total MFT/BNB trades is 0.0001457
Hold Portfolio Value
The asset value from the start to the end with no trades.
Hold portfolio value = (base start asset*current market price)+ quote start asset
From the above example, for the Hold portfolio value is (155248*0.0000809)+23.33=35.89
Current Portfolio Value
Current portfolio value = (base current asset*current market price)+ quote current asset
From the above example, for the Current portfolio value is (202671*0.0000809)+16.419=32.815
Trade P&L
Trade P&L = Current portfolio value - Hold Portfolio value
From the above example, for the Trade P&L value is 32.815-35.89=-3.075
Total P&L
Total P&L = Trade P&L + Fees paid
From the above example, for the Total P&L is -3.075 + -0.428 = -3.504
Return Percentage
Return% = Total P&L/Hold portfolio value
From the above example, for the Return% is -3.075/-35.89 = -9.76%
The Return % (bottom navbar) matches the calculated return on History after the last trade, see following screenshot: