Using Debugger Tools
This section will detail the necessary configuration / setup required to run the debugger tool from your IDE of choice.
VS Code
-
In VSCode, open the Hummingbot folder as your current workspace.
-
Click on the Run and Debug icon in the left-hand pane or press CTRL + Shift + D.
-
Click on the blue link for create a launch.json file
-
Select "Python Debugger" and then "Python File"
-
A window will open up containing the initial
launch.jsoncode. Replace this code with the one provided below: -
Save the changes.
-
Press CTRL + Shift + P and select "Python Interpreter."
-
Make sure to select the Hummingbot conda environment.
By executing the Start Debugging command which can be found under the Run menu at the top or pressing the F5 key, the debugger will automatically attach itself to the Hummingbot process. The Hummingbot app will appear in the integratedTerminal. You may change this as desired.
PyCharm
In the video below, Abel of CoinAlpha has shown how to debug a Script using Pycharm IDE.
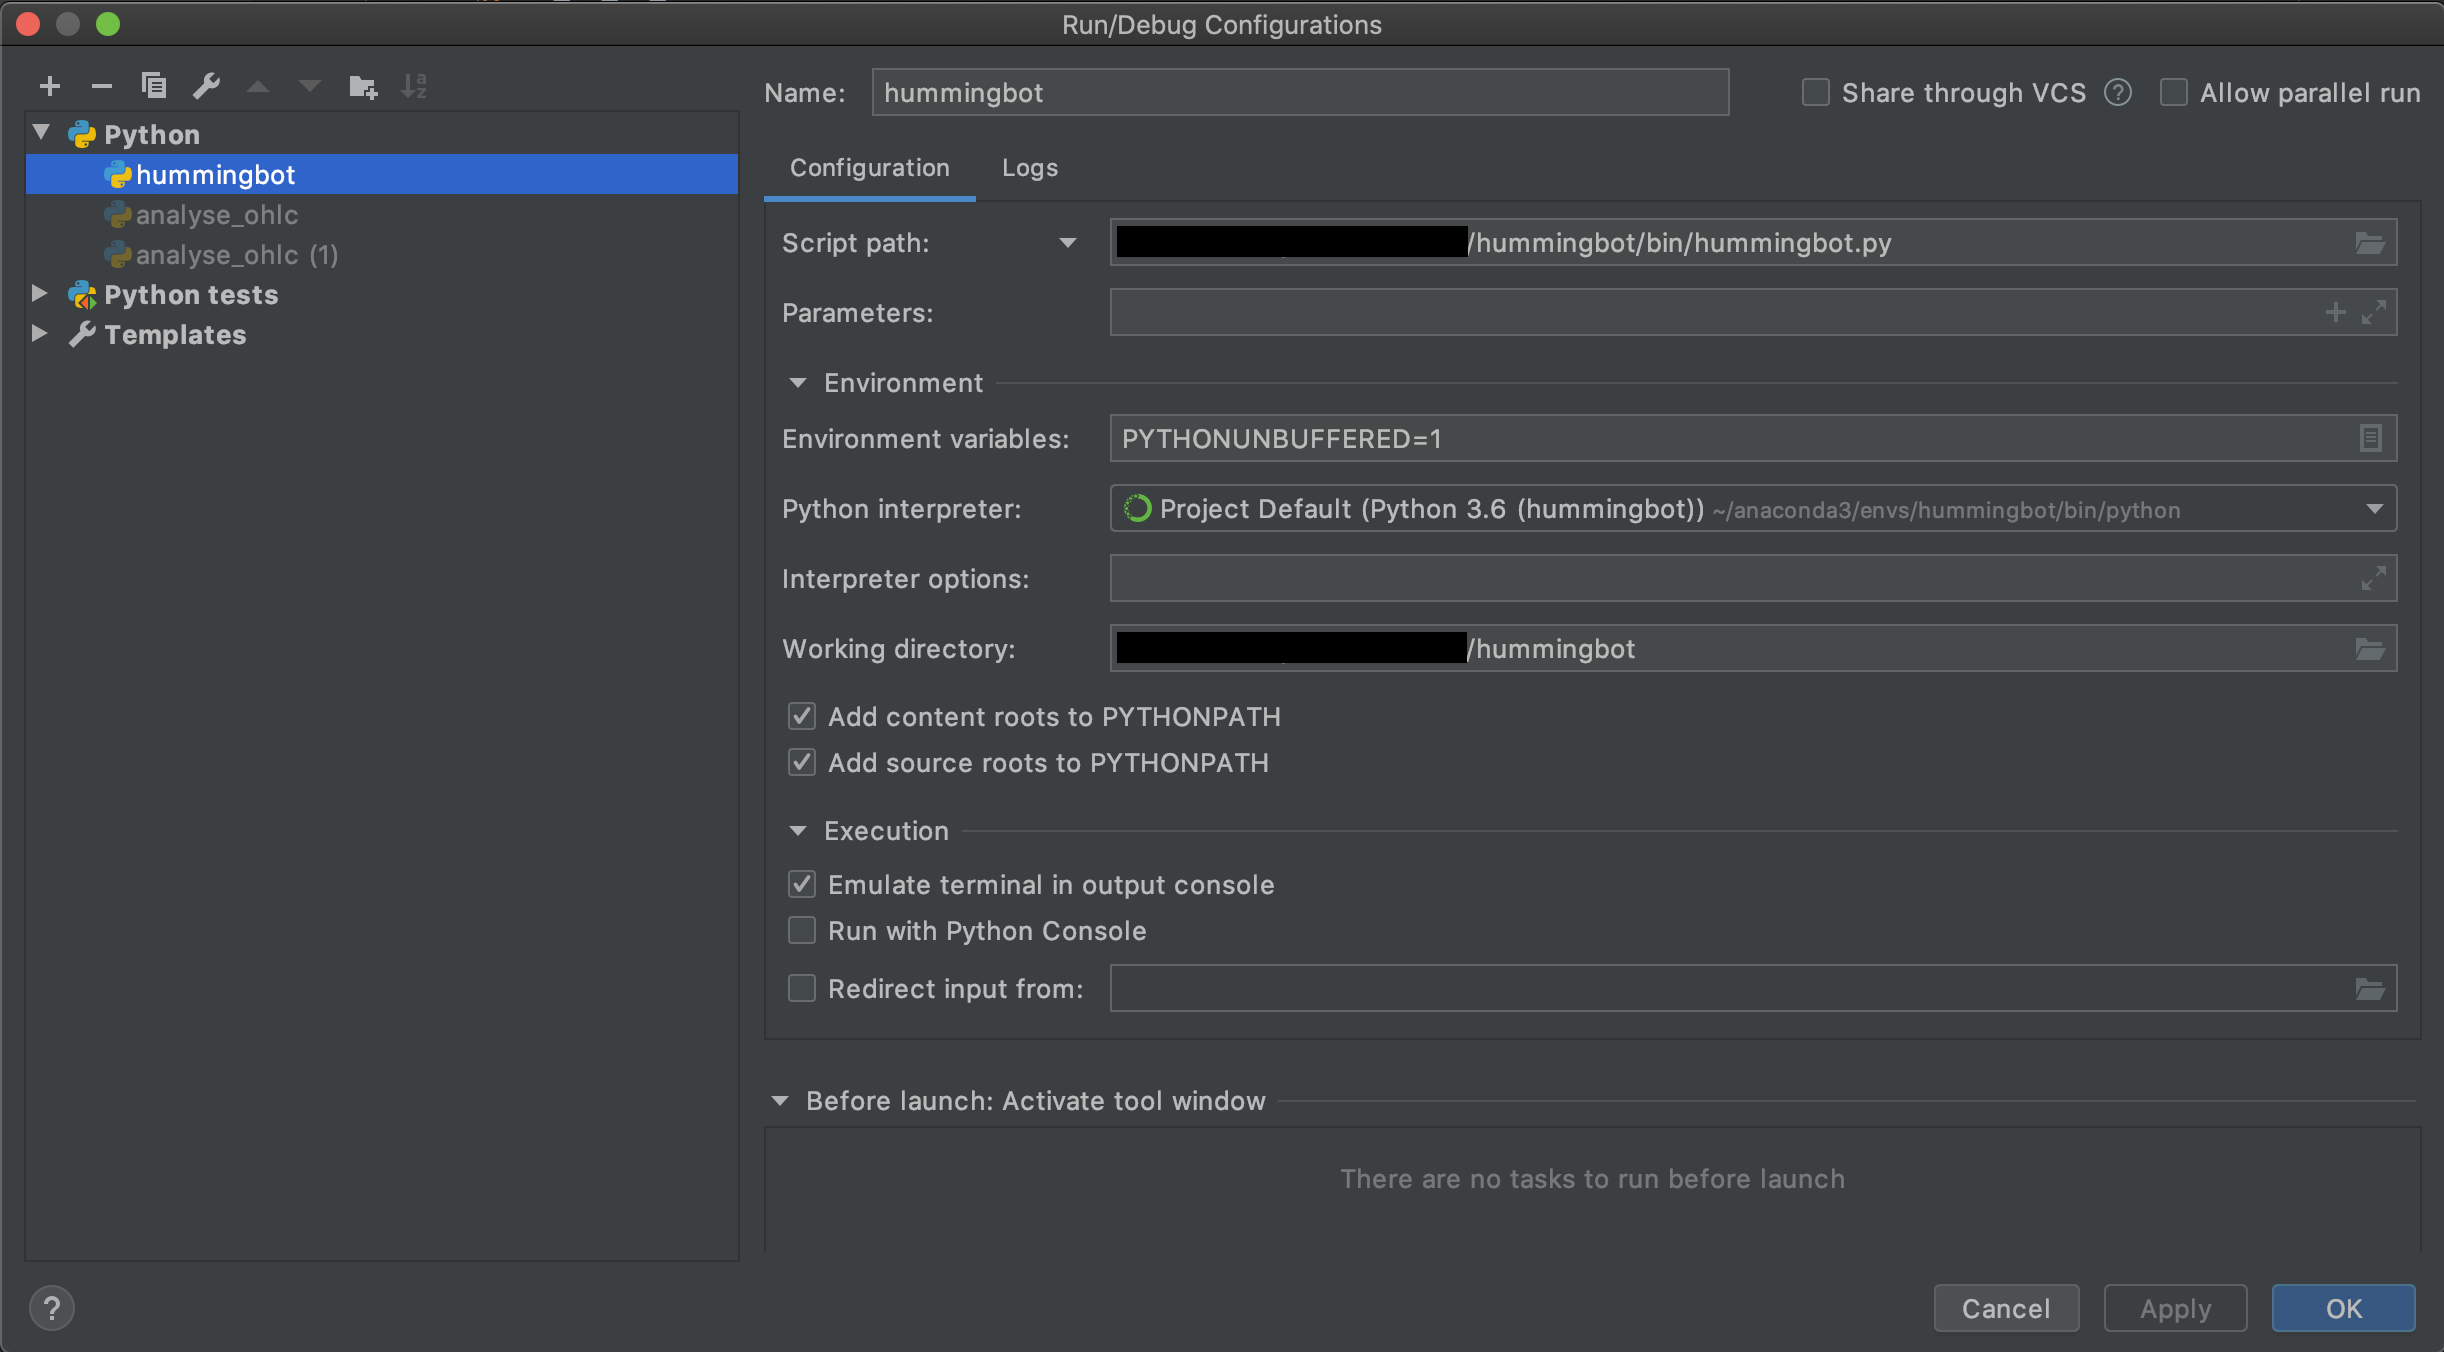
Additionally, for PyCharm, you want to set up the debug configurations, as seen in the screenshot below.
For debugging it is neccessary that Gevent compatible in Python Debugger settings is enabled. See
Stackoverflow Q&A.
Note
As of this writing, there is no way to add breakpoints/log points to any of the Cython code in VSCode or PyCharm.