Debug Console
The debug console is a powerful tool for Hummingbot developers to inspect and modify the live states in Hummingbot while it's running. It gives access to a live Python console living in the same process as Hummingbot. It can be thought of as similar to the developer console found in most modern browsers.
Activating the Debug Console
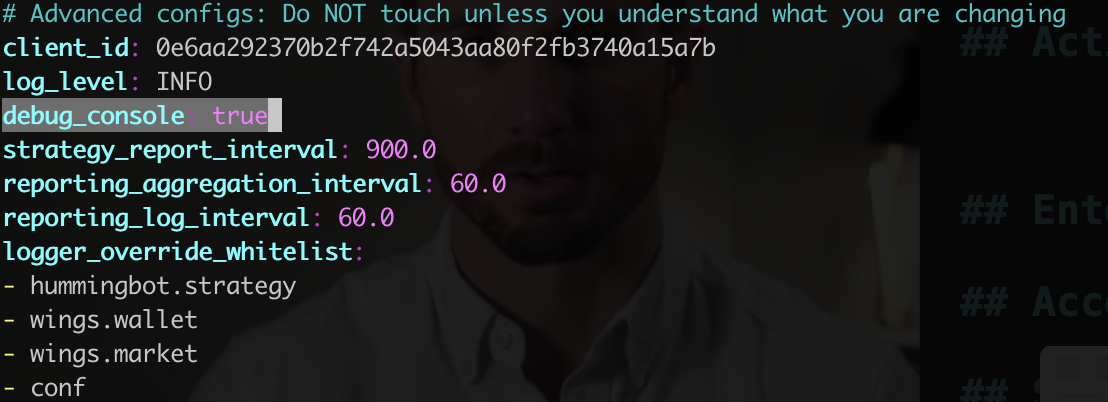
The debug console is disabled by default. You need to enable it by setting debug_console: true in the hummingbot_conf/conf_client.yml file.
Entering the Debug Console
When you start Hummingbot with debug console enabled, it will print out a "Started debug console" log message at start.
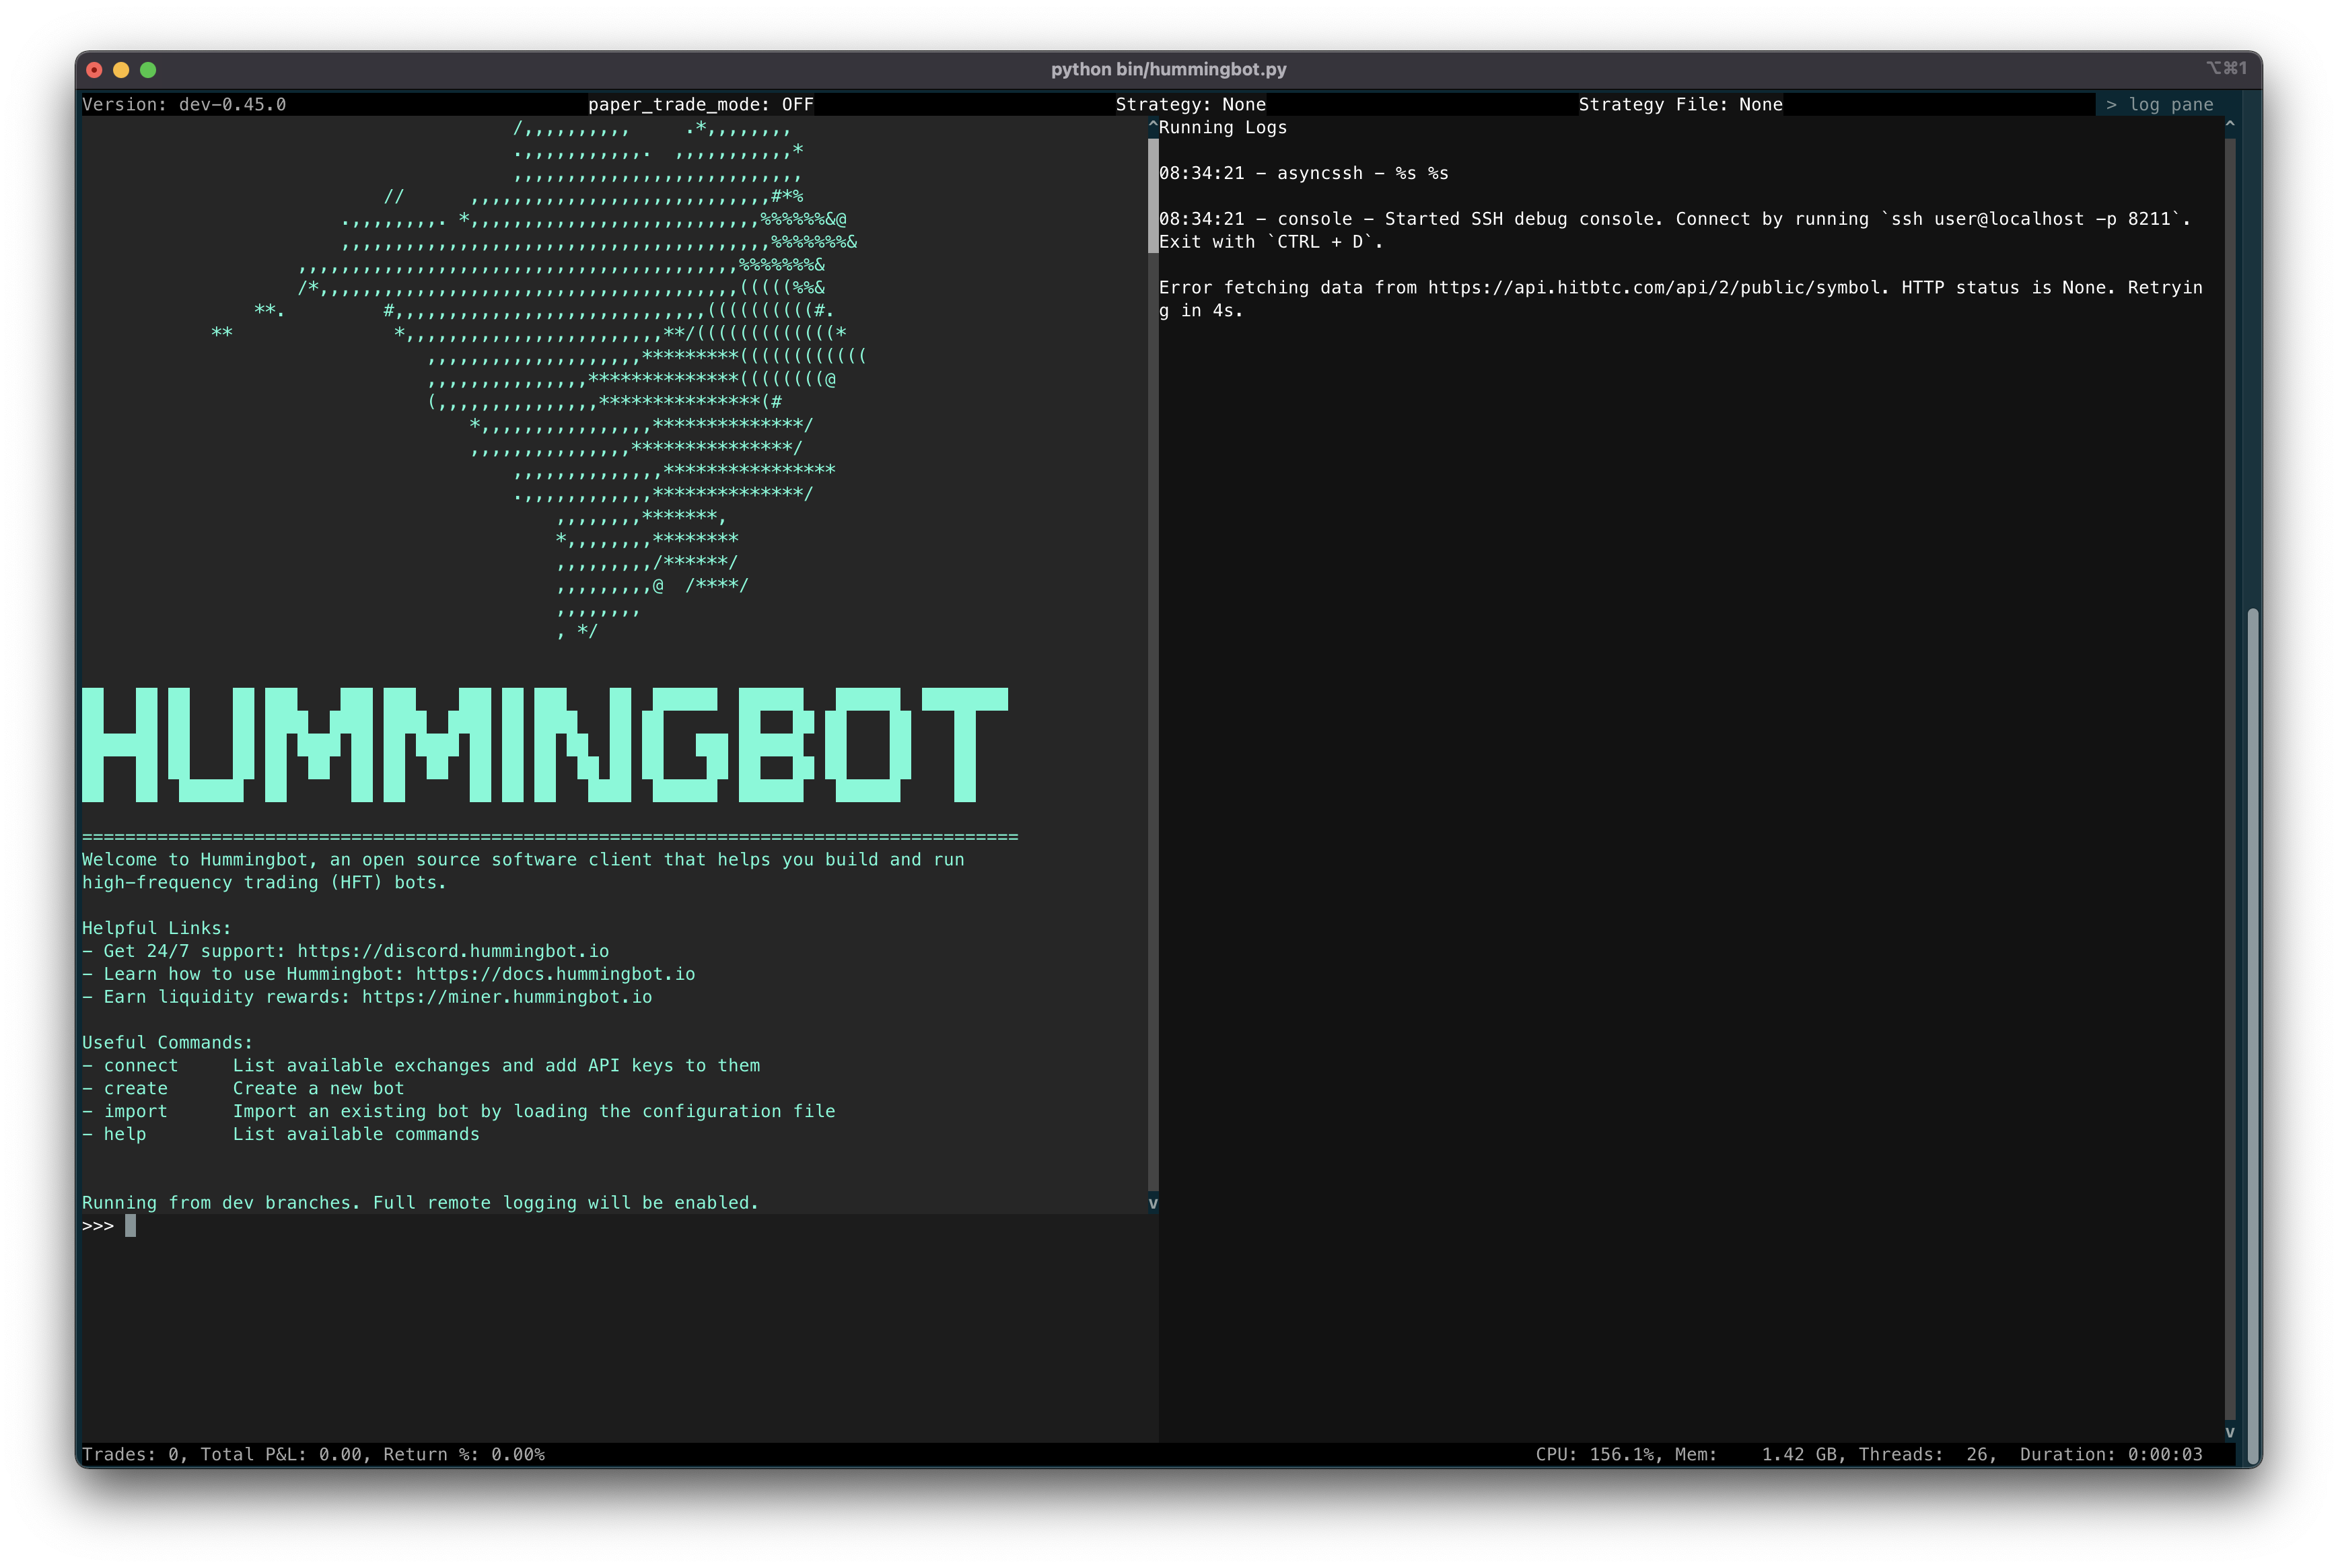
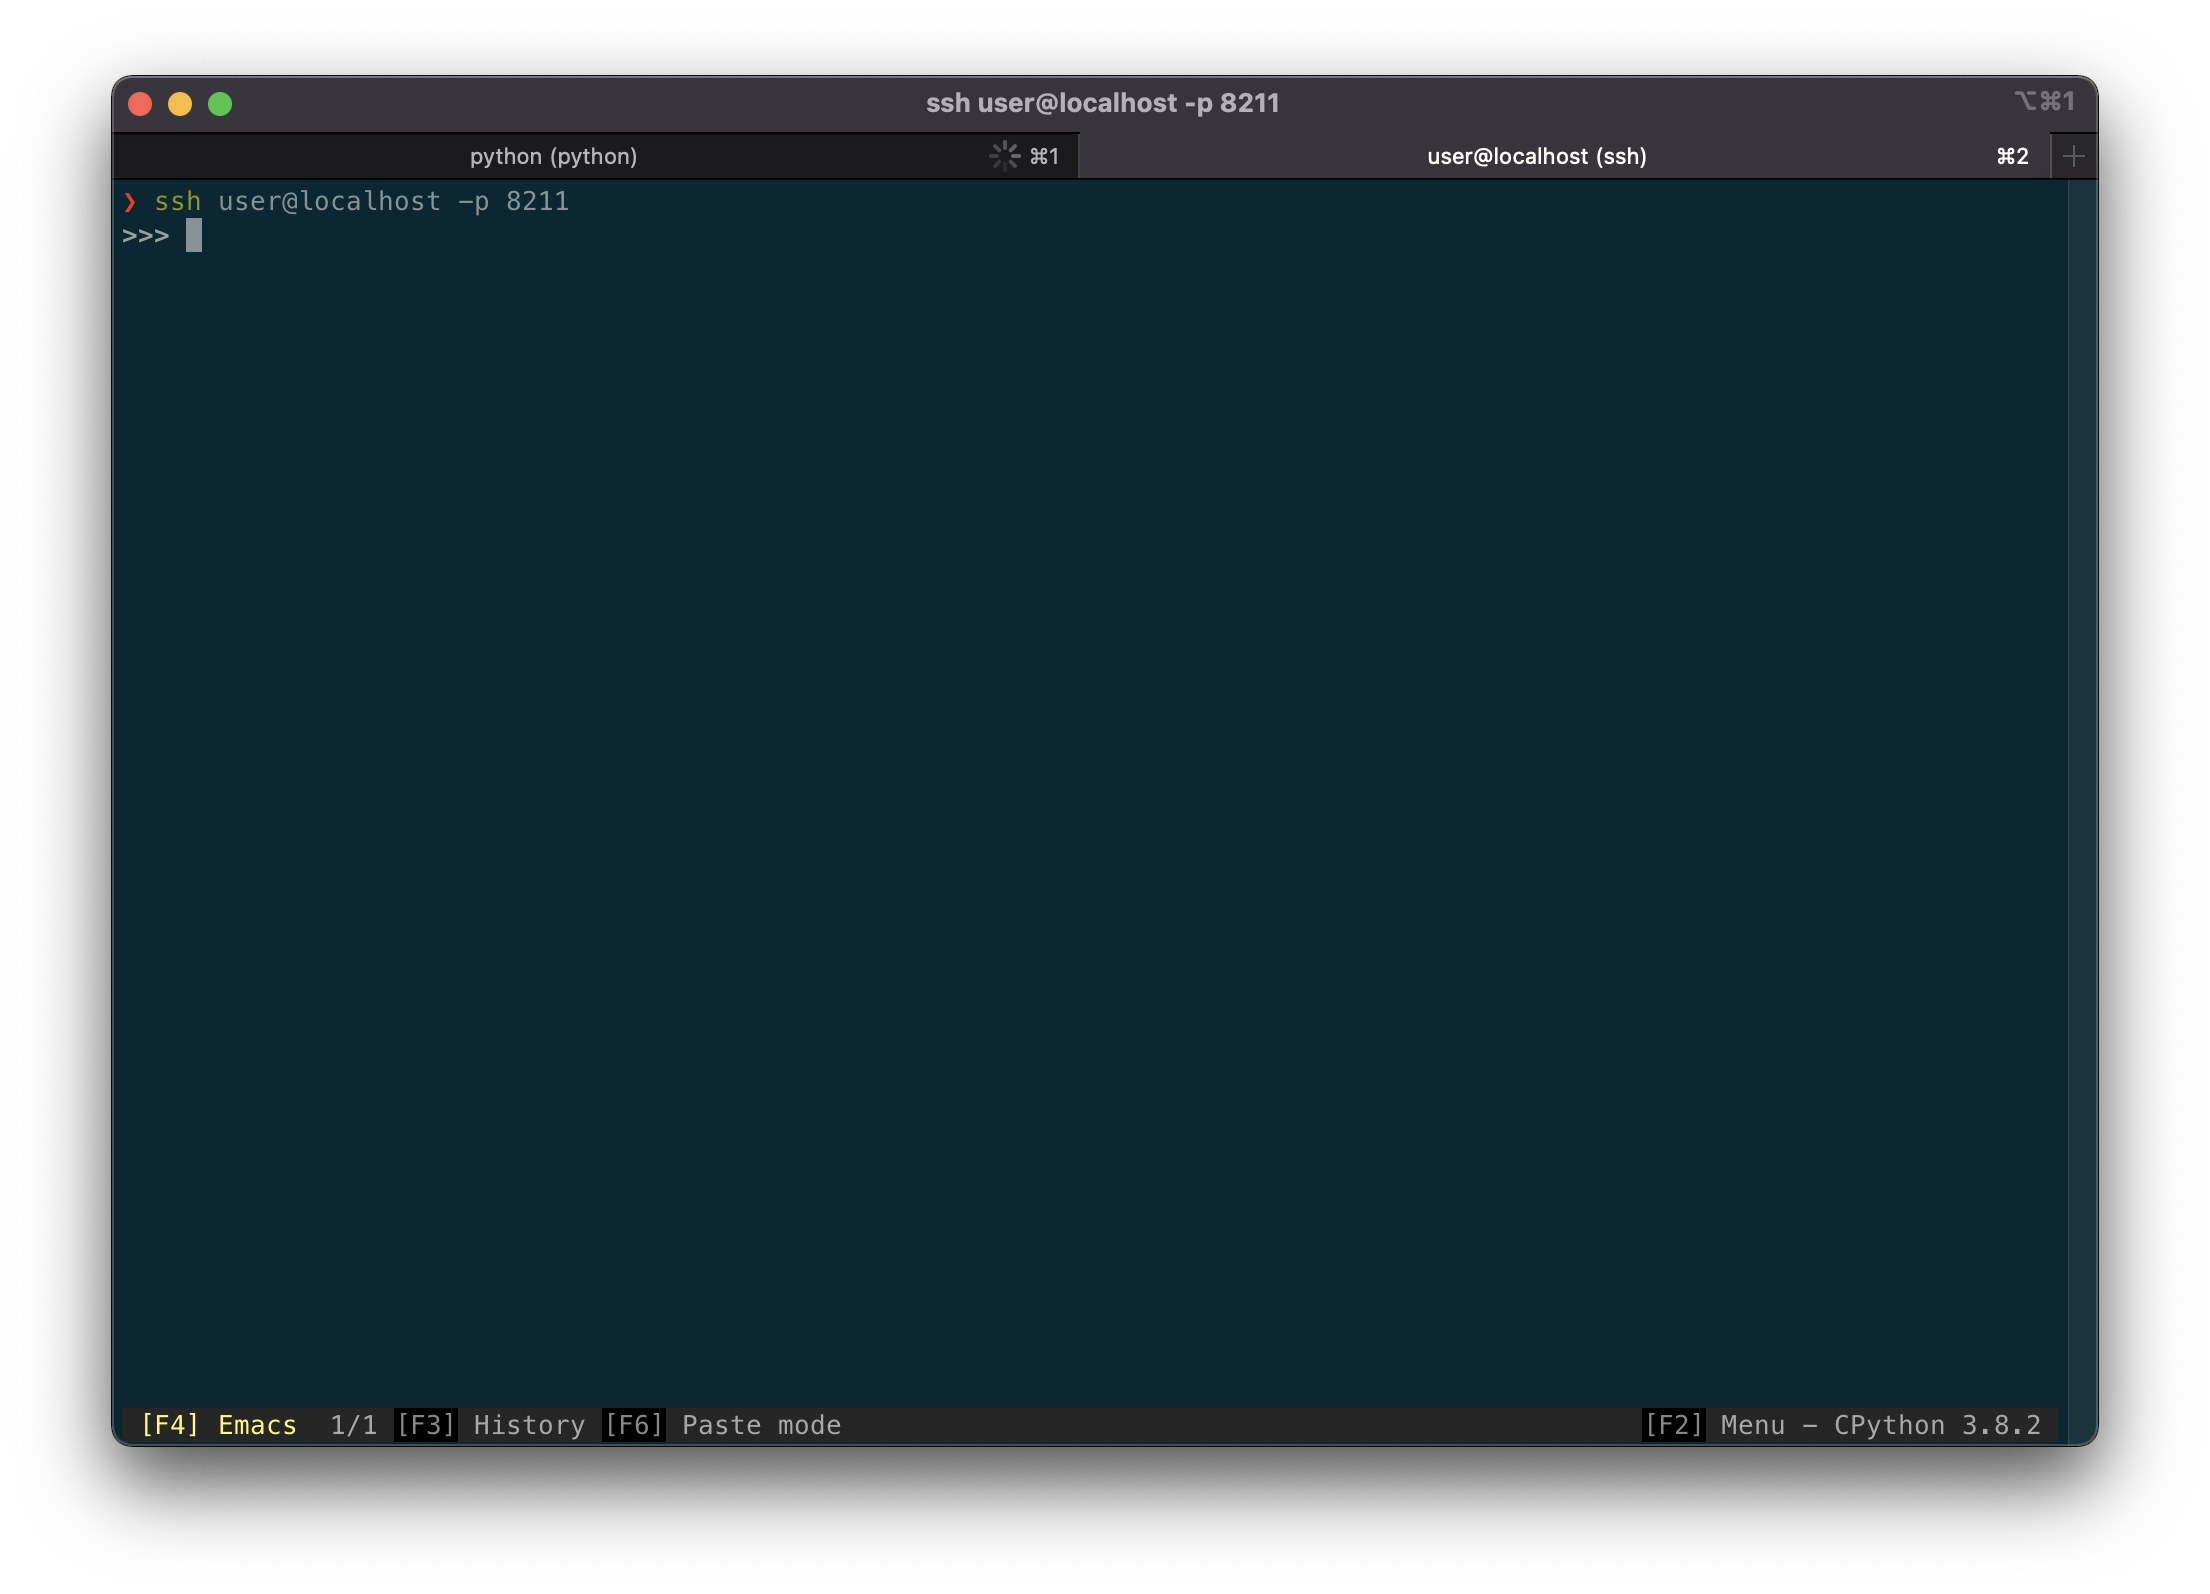
As specified in the message, you can use ssh to access the debug console and exit with CTRL + D. The server accepts any user name (i.e. ssh random@localhost -p 8211 works just as well).
Accessing Python Modules and Exposed Objects
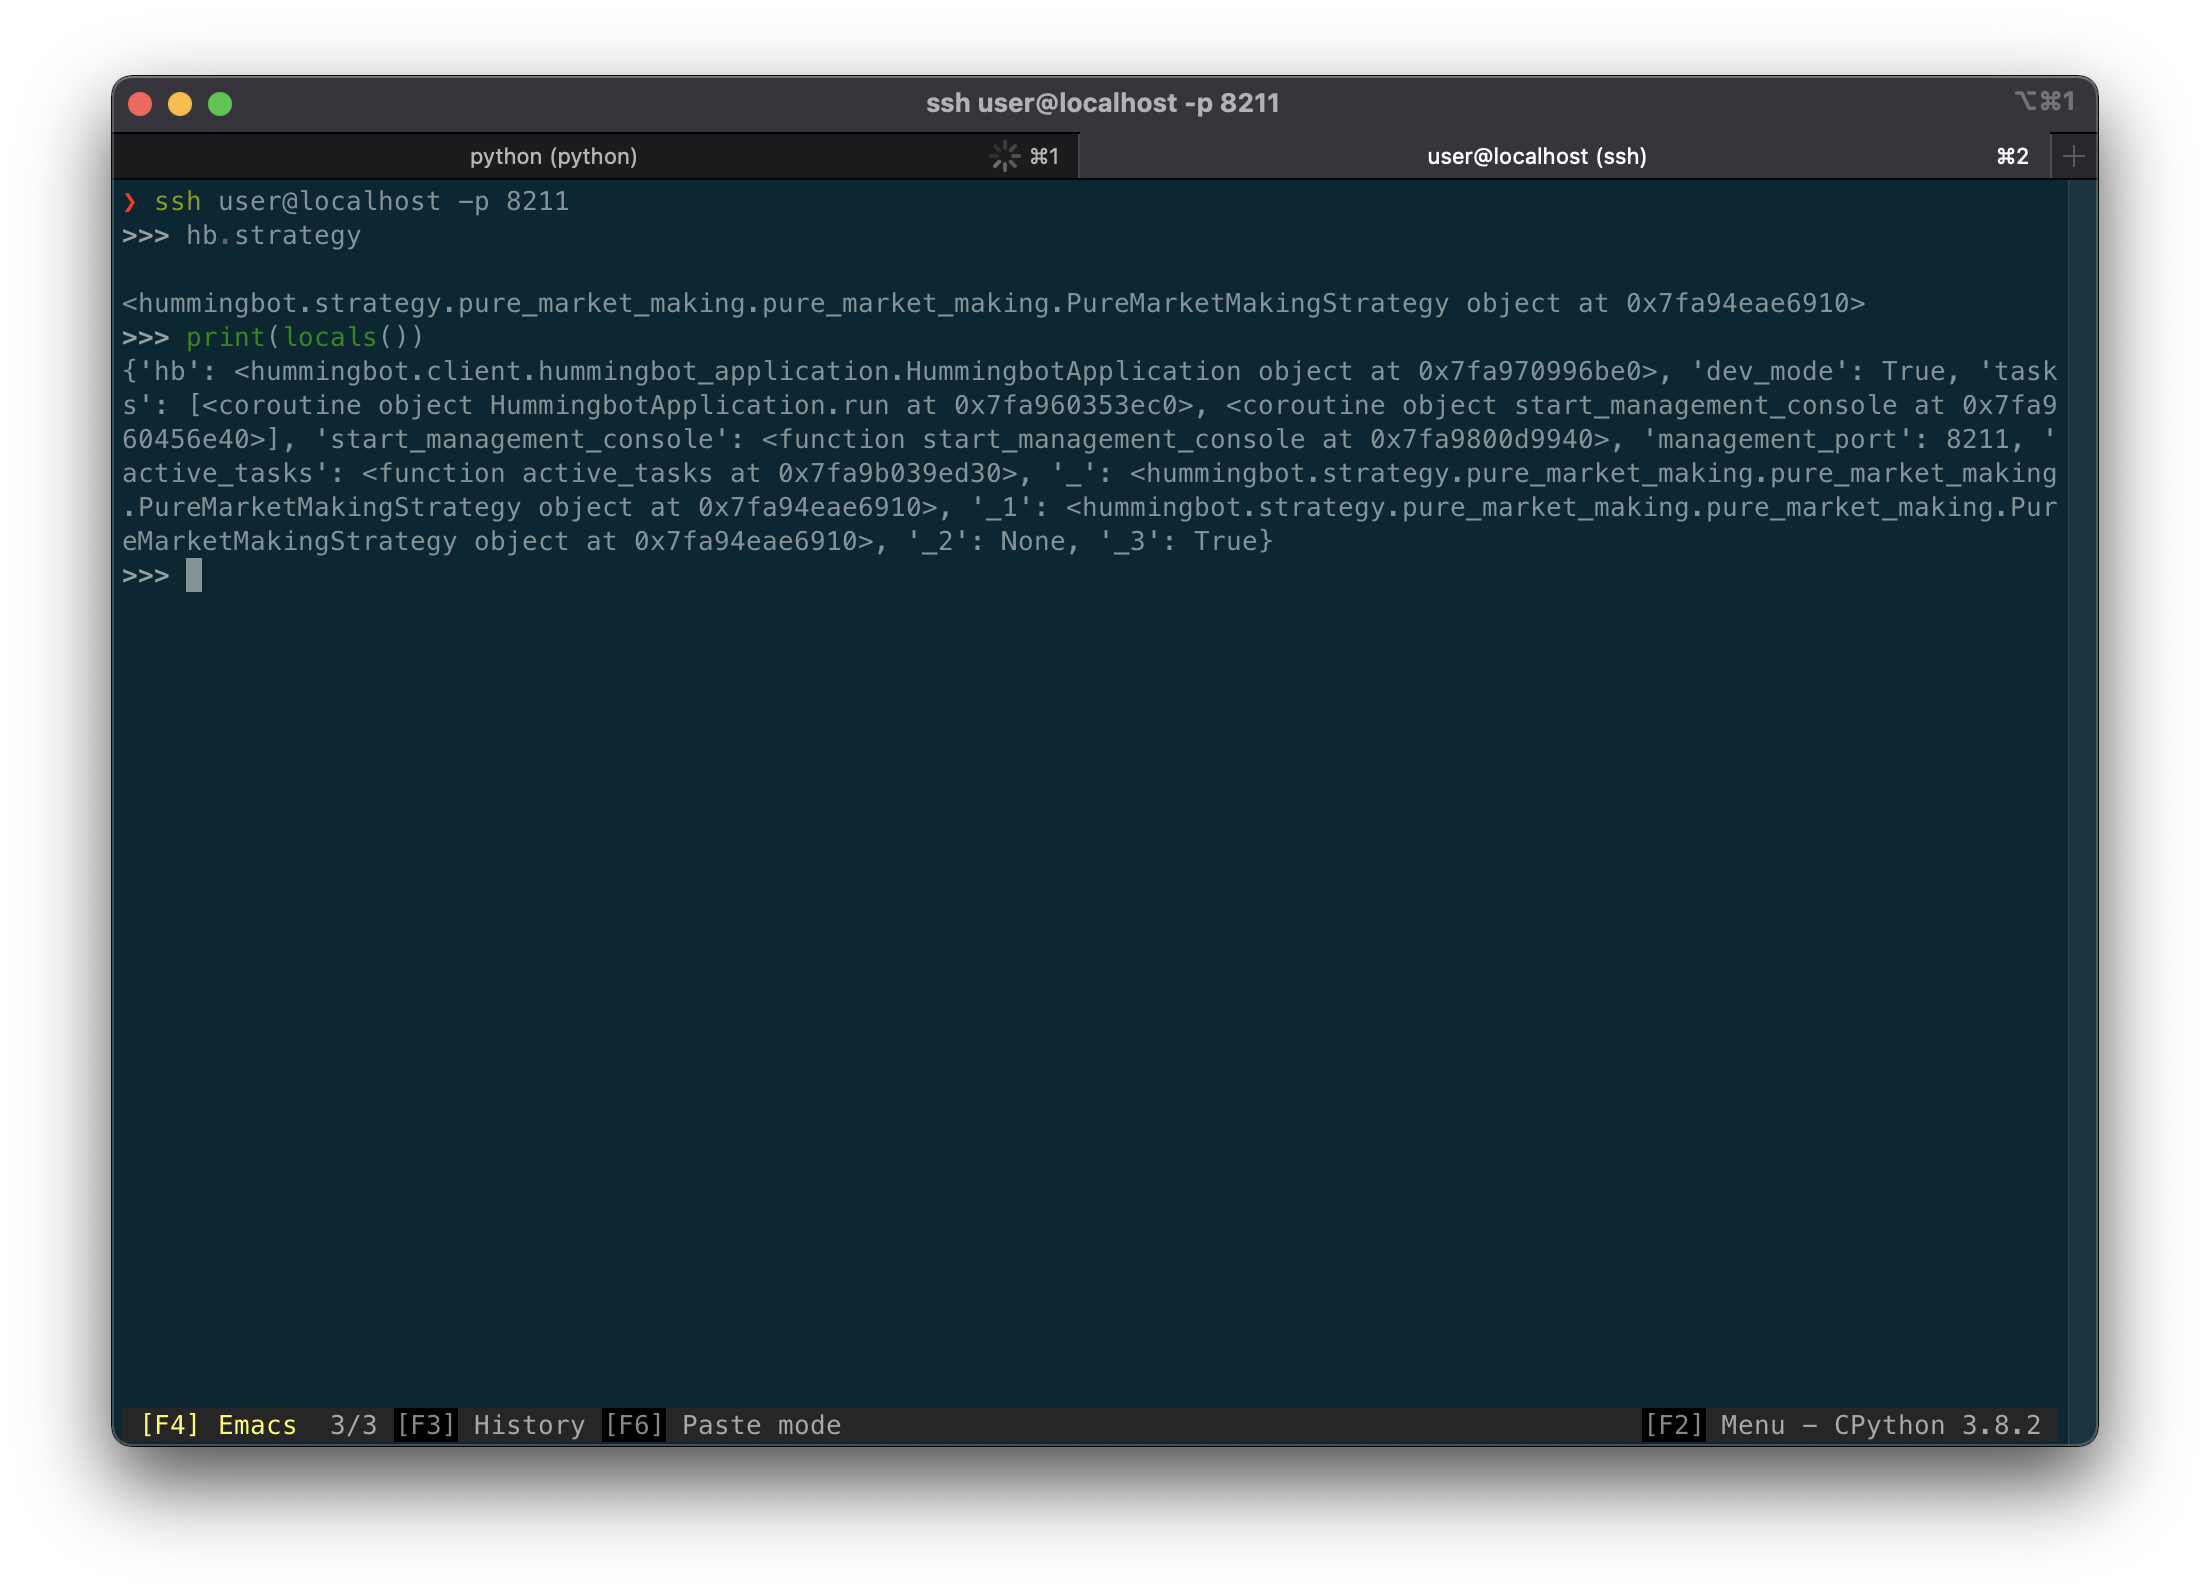
Once you've entered the debug console, you have access to a fully featured Python interpreter living in the Hummingbot process.
You can access all the exposed properties under the HummingbotApplication class via the hb object.
Here are some of the exposed properties you can access from the debug console:
hb.strategy: The currently active strategy objecthb.markets: A dictionary of active market connectorshb.acct: The currently active Ethereum wallet objecthb.clock: The clock object that's driving all the Hummingbot components
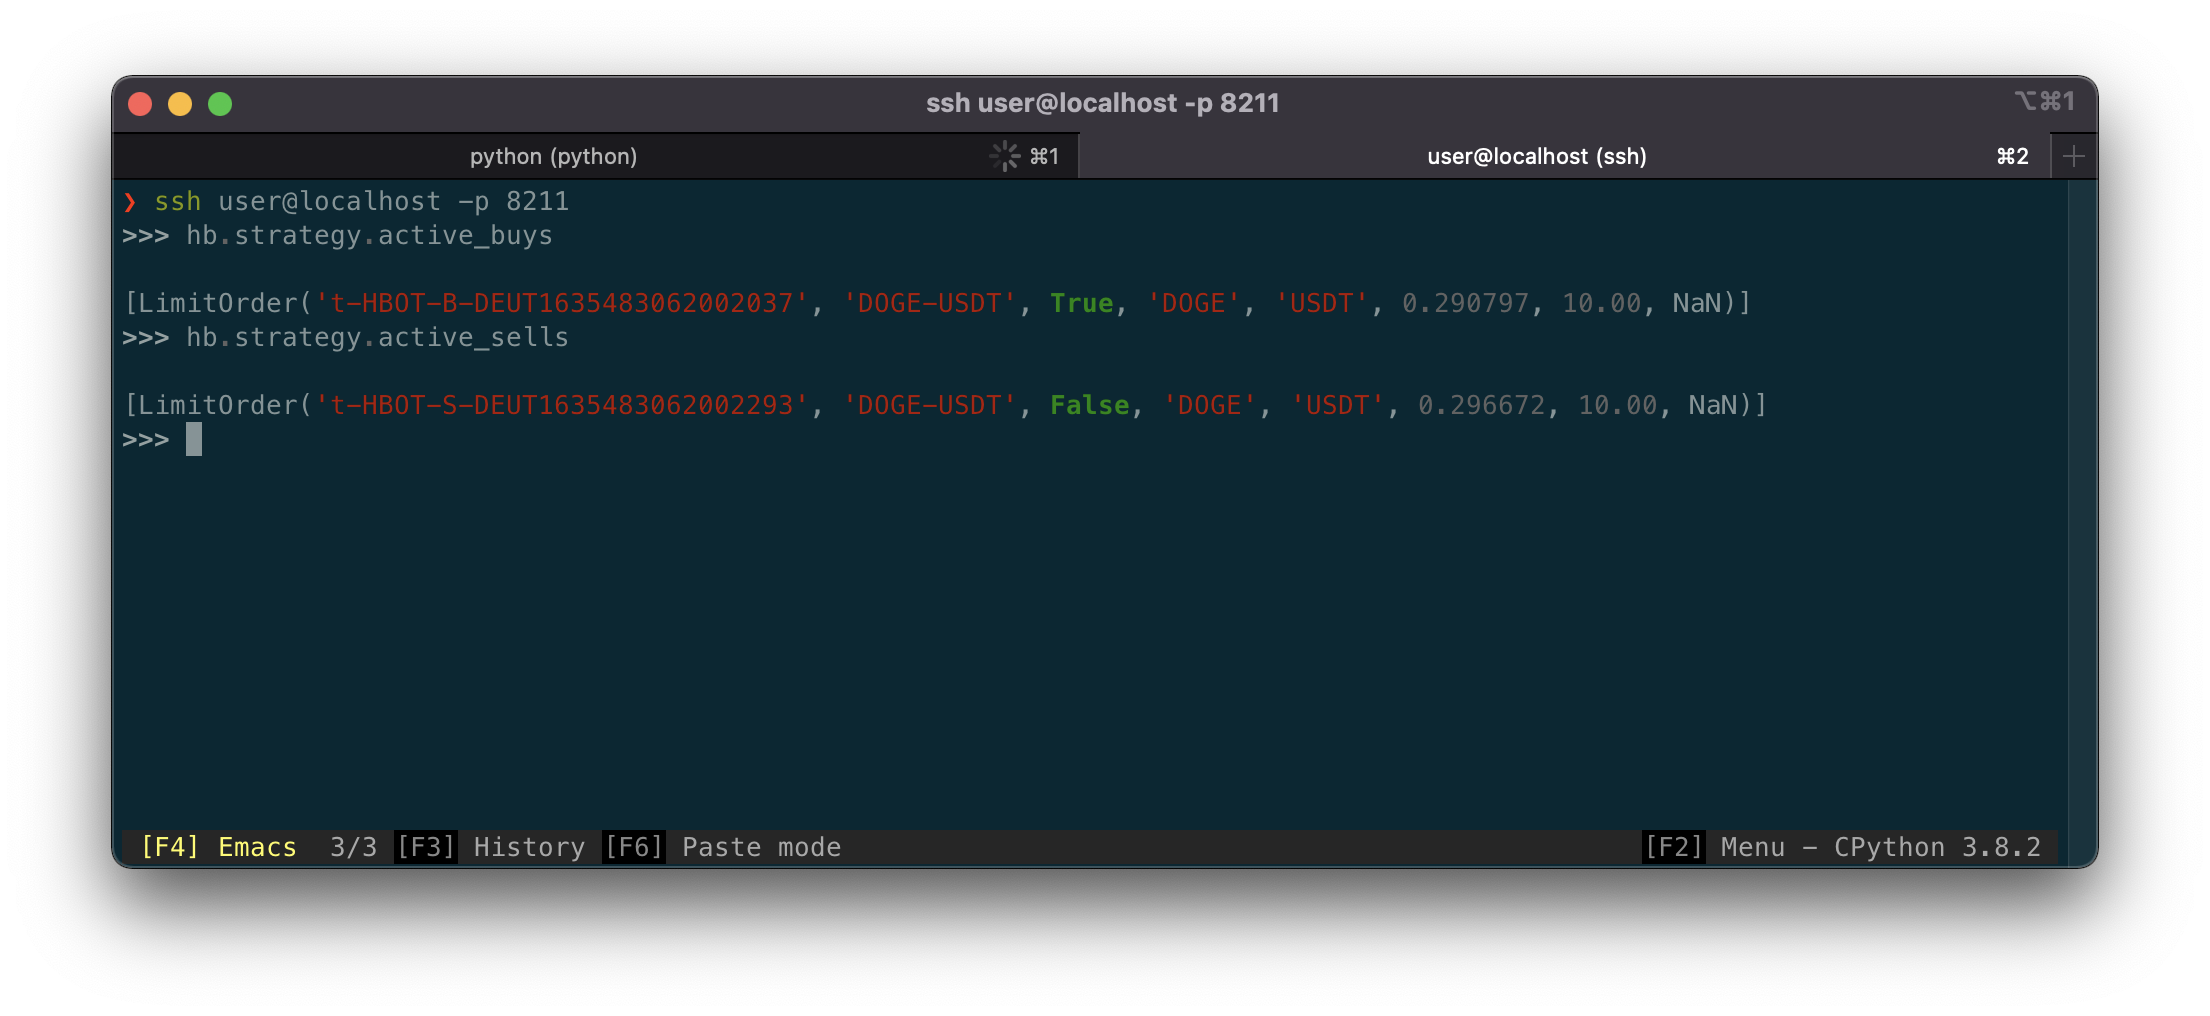
Sample Ways to Use the Console
Below is an example where a developer queries the currently active bids/asks under the strategy.
You should refer to the source code of the exposed objects to see what properties you can inspect and modify inside the debug console.